User Interface
Introduction
Section titled “Introduction”The Snowflake emulator provides a User Interface (UI) via the LocalStack Web Application. The User Interface allows you to:
- Run SQL queries and view results using a Query Editor.
- View detailed request/response traces of API calls.
- Forward queries to a real Snowflake instance using a proxy.
To access the User Interface, you need to start the Snowflake emulator and access the Snowflake tab in your default instance of the LocalStack Web Application. This User Interface is available only when the Snowflake emulator is running. Please note that it does not connect to the real Snowflake cloud environment (except during a proxy connection) or any other external service on the Internet.
Getting started
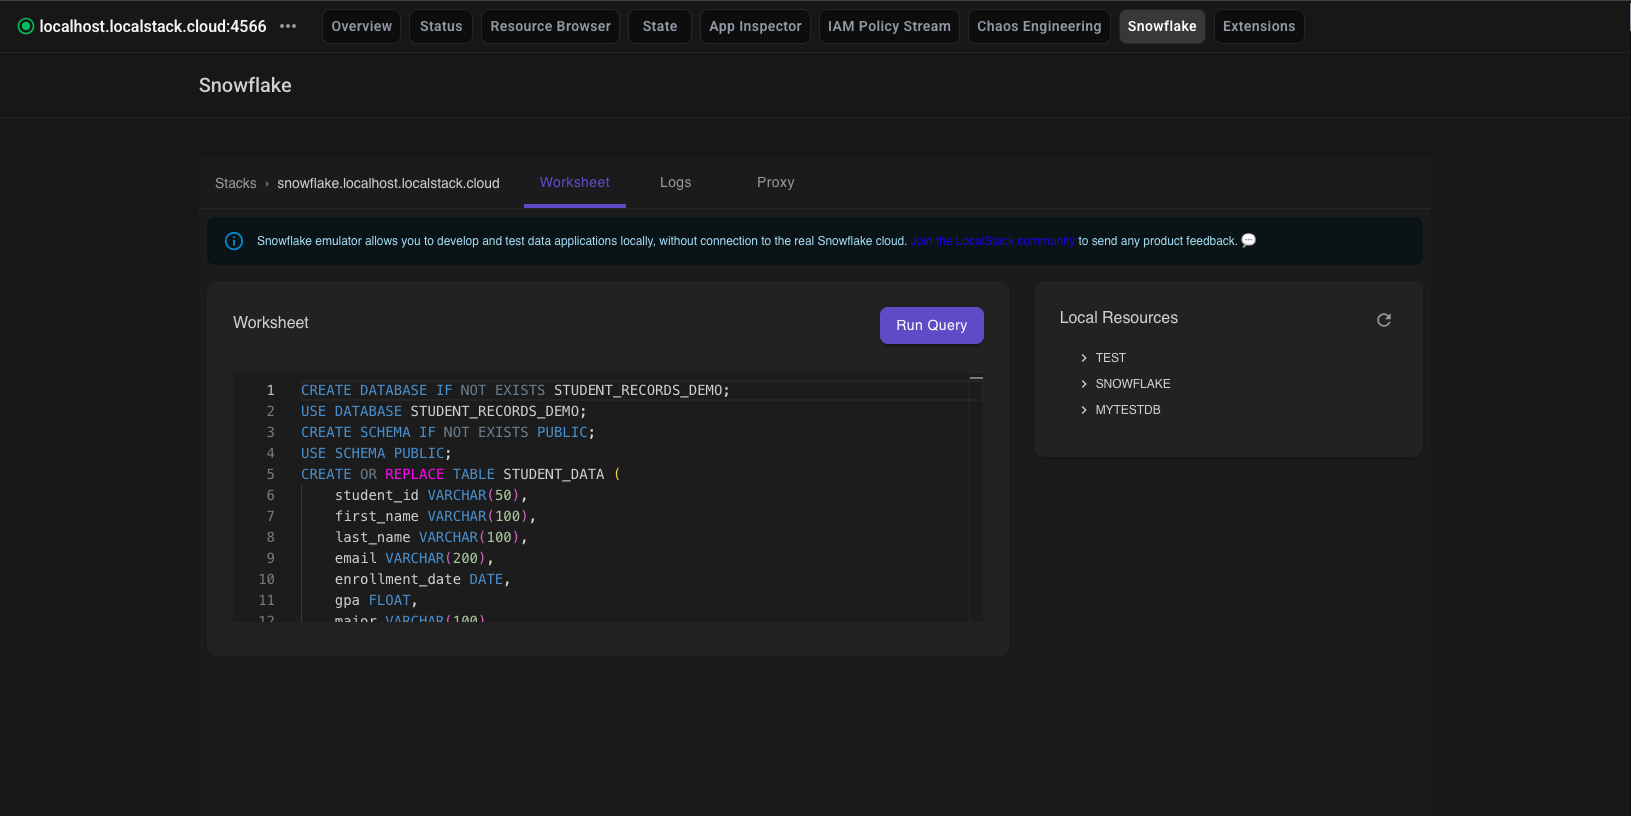
Section titled “Getting started”This guide is designed for users new to the Snowflake emulator Web UI. Start your Snowflake emulator using the following command:
export LOCALSTACK_AUTH_TOKEN=<your_auth_token>localstack start --stack snowflakeNavigate to https://app.localstack.cloud/inst/default/snowflake to access the User Interface.
Run SQL queries
Section titled “Run SQL queries”The User Interface provides a SQL Worksheet tab that allows you to run SQL queries and view results. The editor includes SQL syntax highlighting and autocomplete for SQL keywords, Snowflake built-in functions, and schema objects such as databases, tables, and columns.
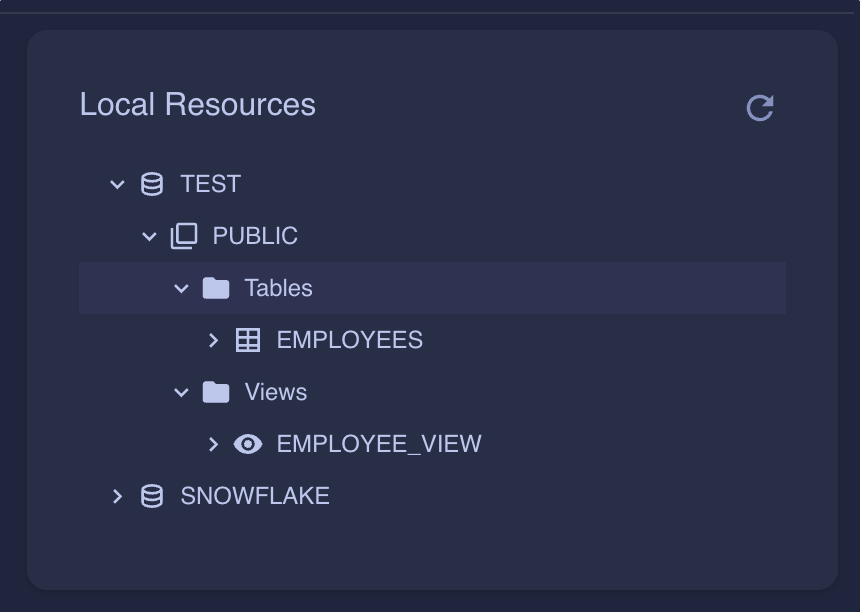
Use the Local Resources panel on the right to explore your schema objects in a hierarchical tree. Each node type — database, schema, table, view, column, and folder — is represented by a dedicated icon. Views are displayed as a distinct category alongside tables within each schema.
You can run the current statement by placing your cursor inside it, or execute only a selected portion of SQL from the editor.
Multi-statement query support
Section titled “Multi-statement query support”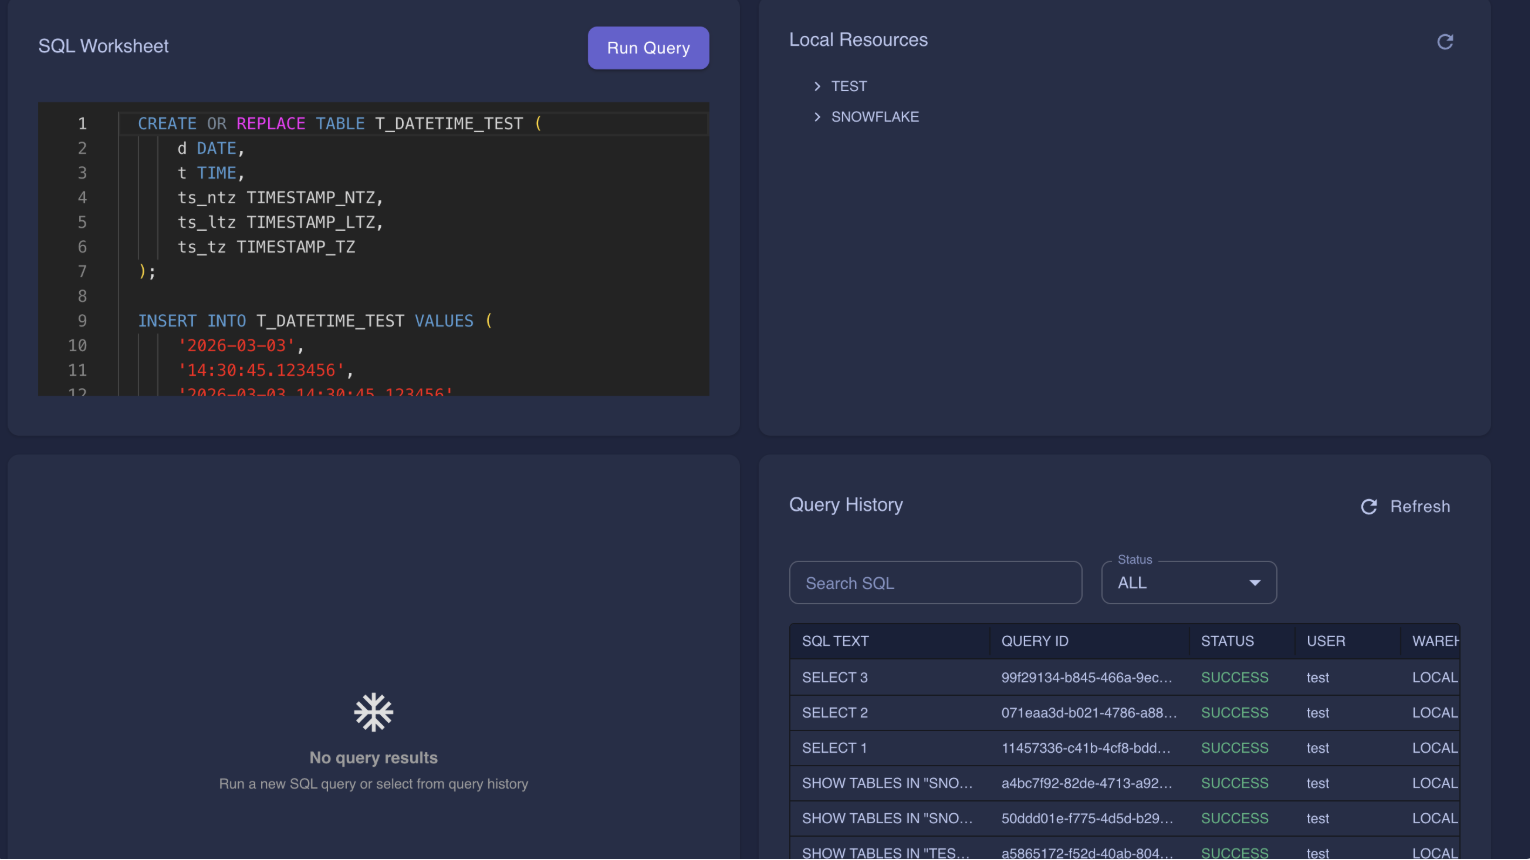
The SQL Worksheet supports executing multiple SQL statements in a single run. When a multi-statement query is submitted, results are displayed in a scrollable tabbed interface, with each tab labeled Statement 1, Statement 2, and so on. If a statement fails, its corresponding tab is highlighted to make it easy to identify errors.
View Query History
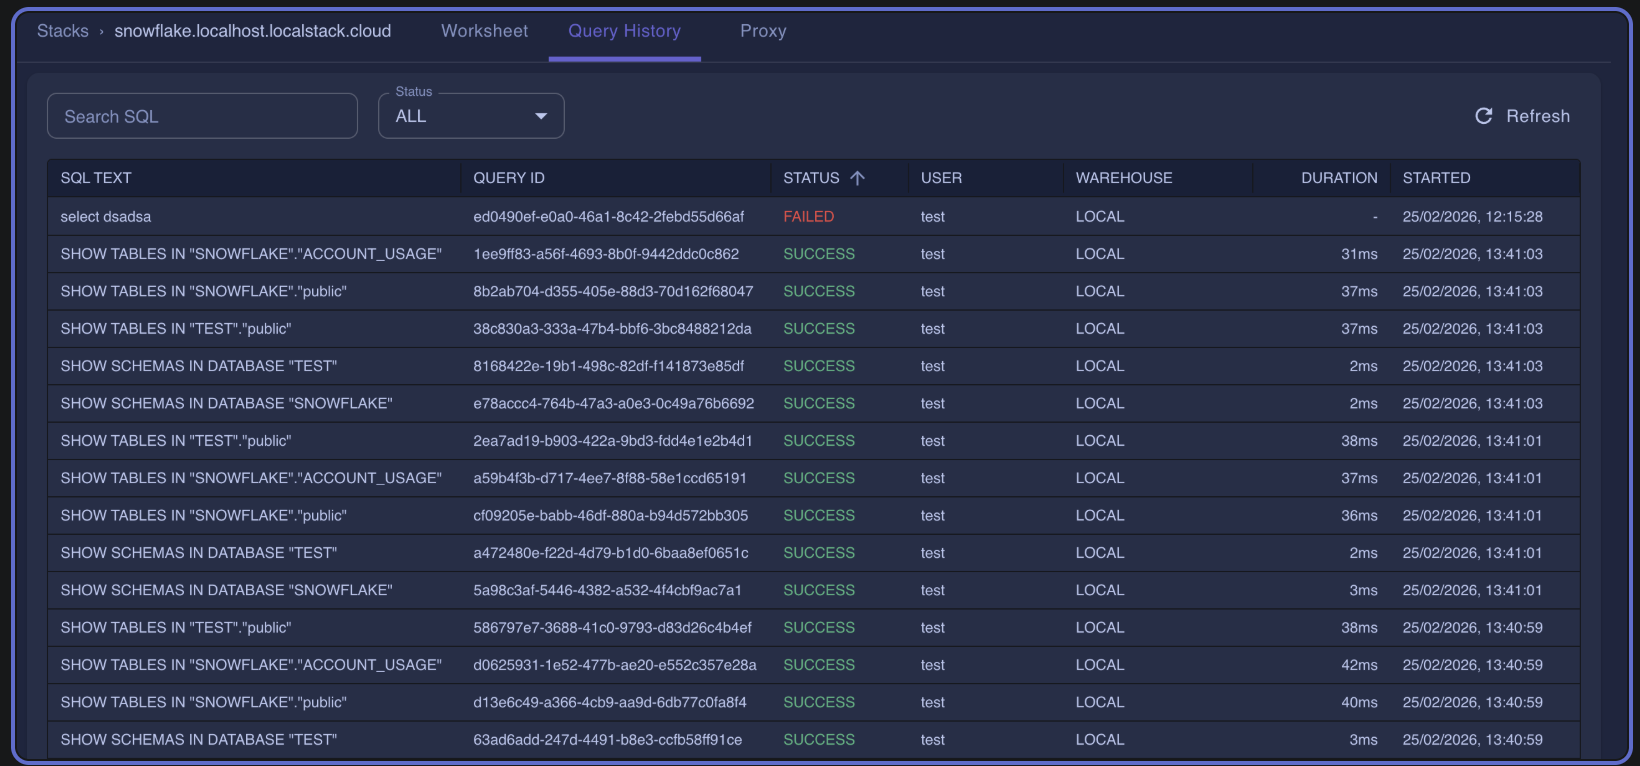
Section titled “View Query History”The User Interface provides a Query History tab that displays recently executed queries along with their execution details.
Each entry includes metadata such as the query ID, SQL text, execution status, duration, rows returned, and the database, schema, and warehouse used during execution.
You can search and filter the query history to quickly locate queries by text, execution status, or time range.